
Task 1 – Mô tả biểu đồ
Chọn dạng biểu đồ, vào phòng thi và viết trong 20 phút (ít nhất 150 từ). Nộp bài xong, bài mẫu hiện ngay bên cạnh để bạn so sánh.
🔄 Đang cập nhật thêm dạng bài và chủ đề mới.
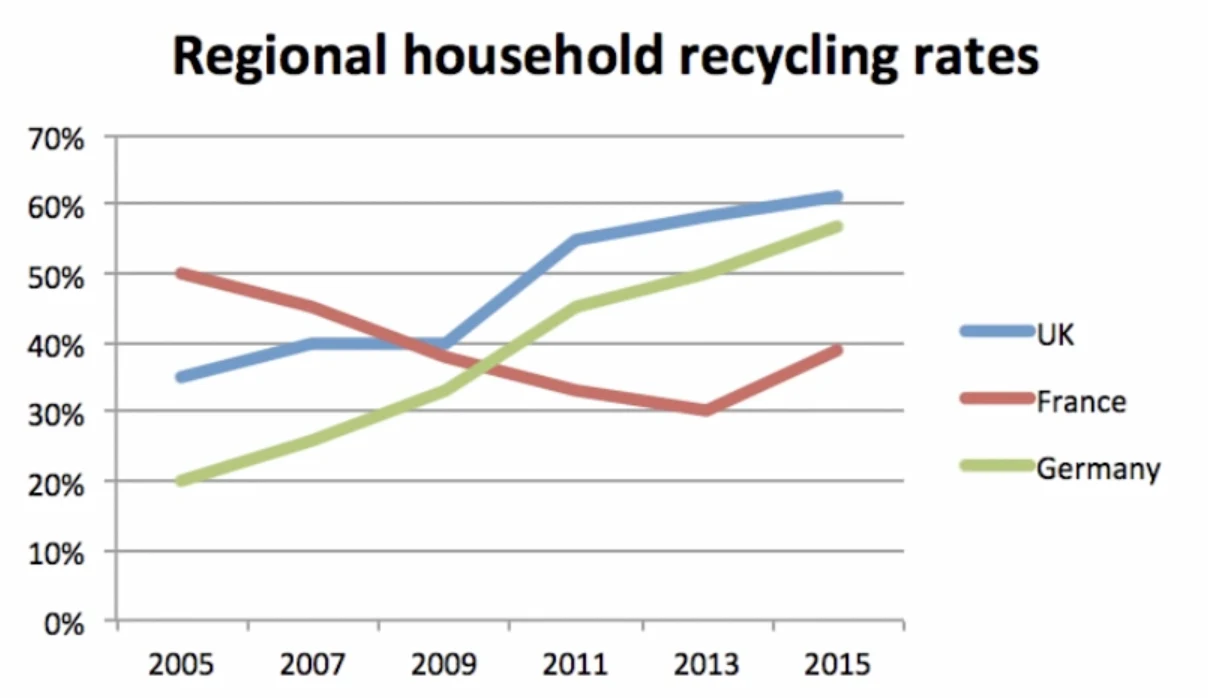
The graph below shows the household recycling rates in three different countries between 2005 and 2015.
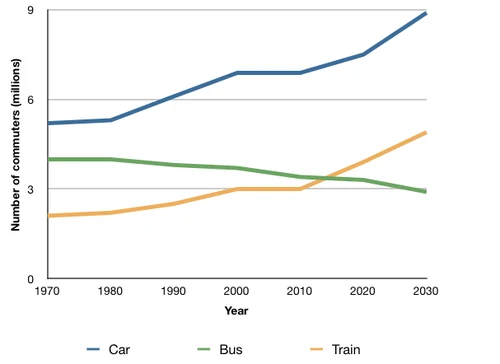
The graph below shows the average number of UK commuters travelling each day by car, bus or train between 1970 and 2030.
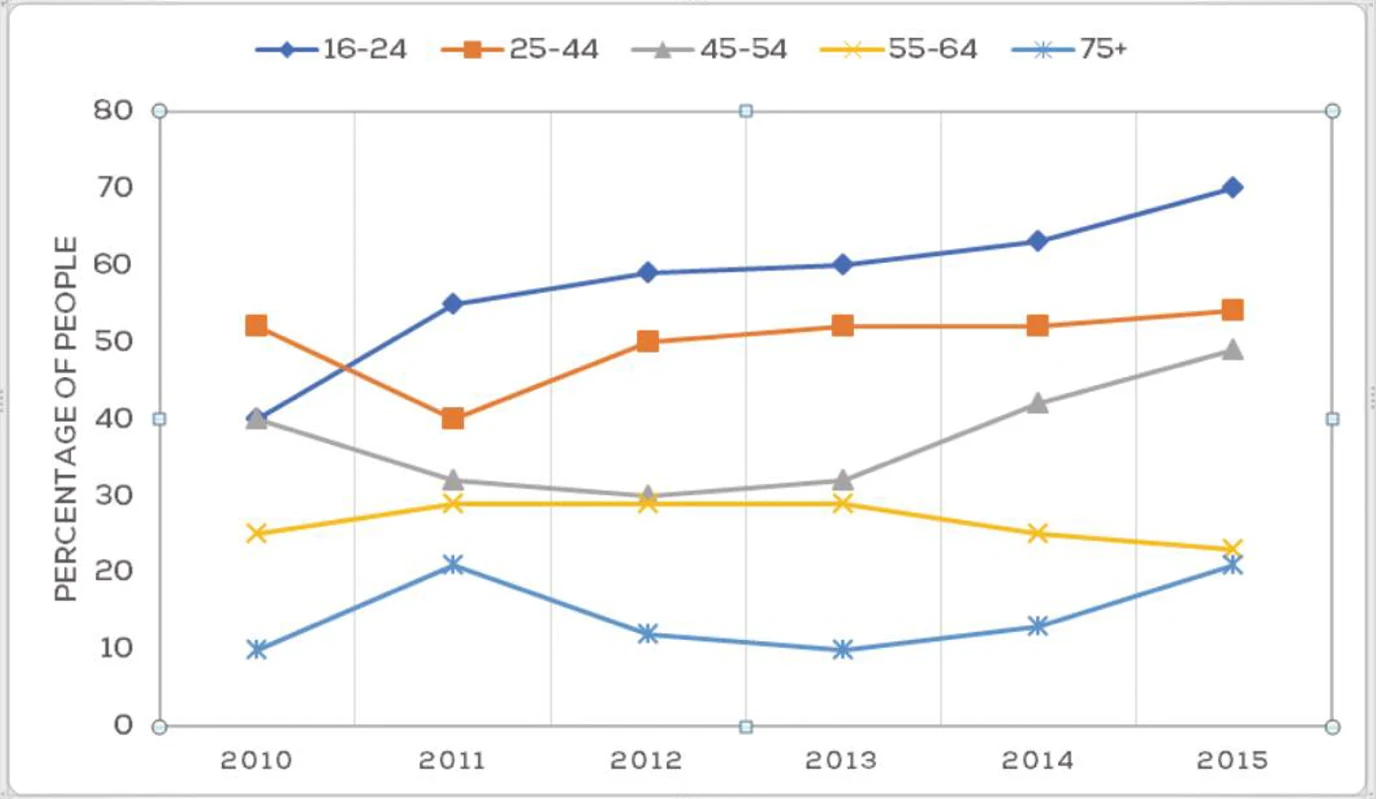
The graph below shows the percentage of people in different age groups in one city who attended music concerts between 2010 and 2015.
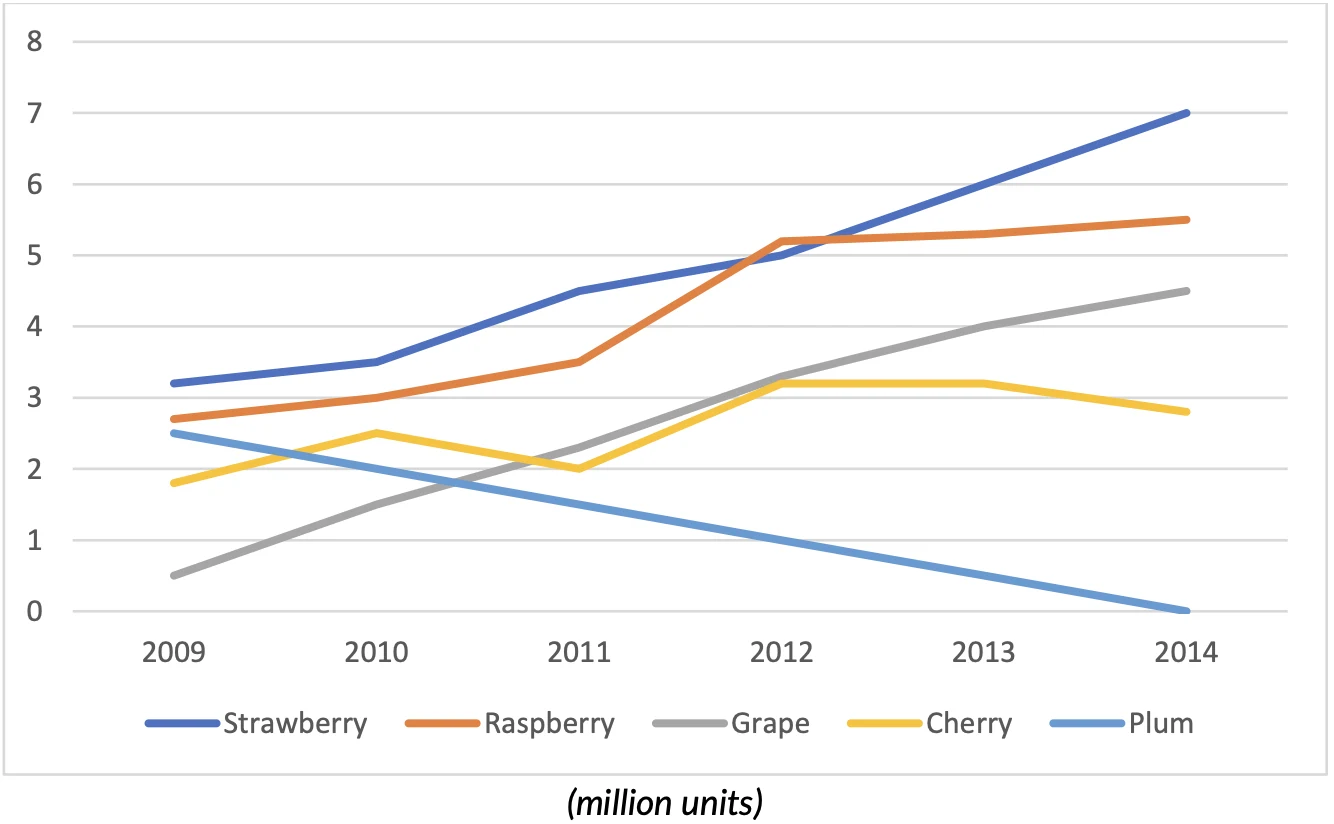
The chart below shows the sales of five different kinds of jam from 2009 to 2014.
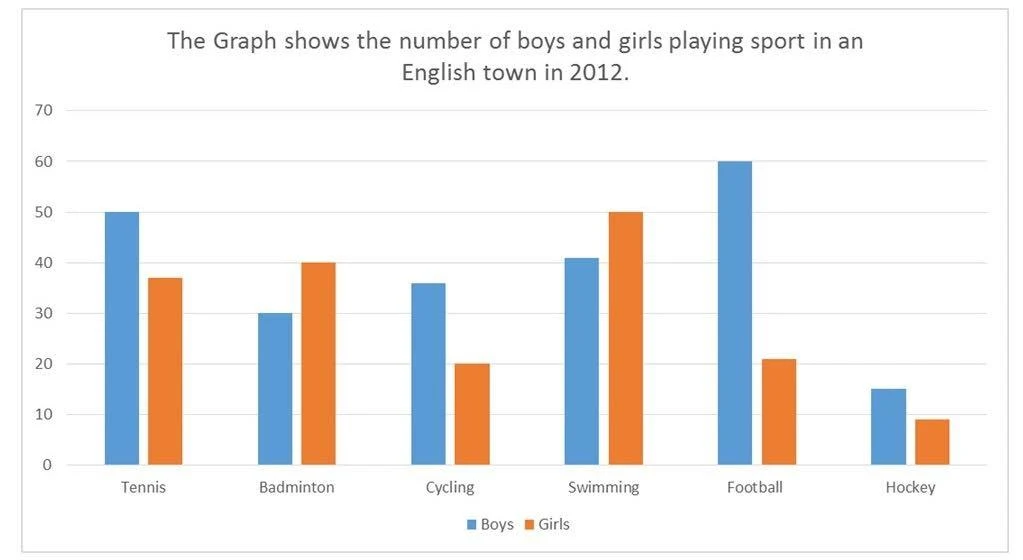
The graph shows the number of boys and girls playing sport in an English town in 2012.
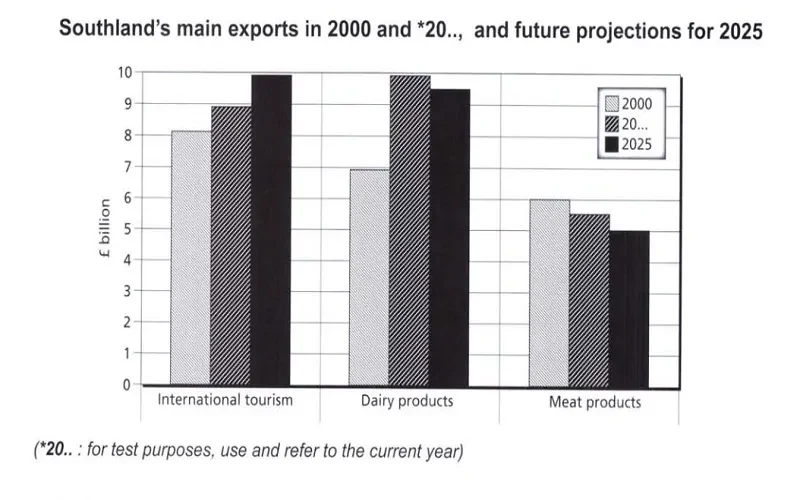
The chart below gives information about Southland’s main exports in 2000 and 2022, and future projections for 2025.
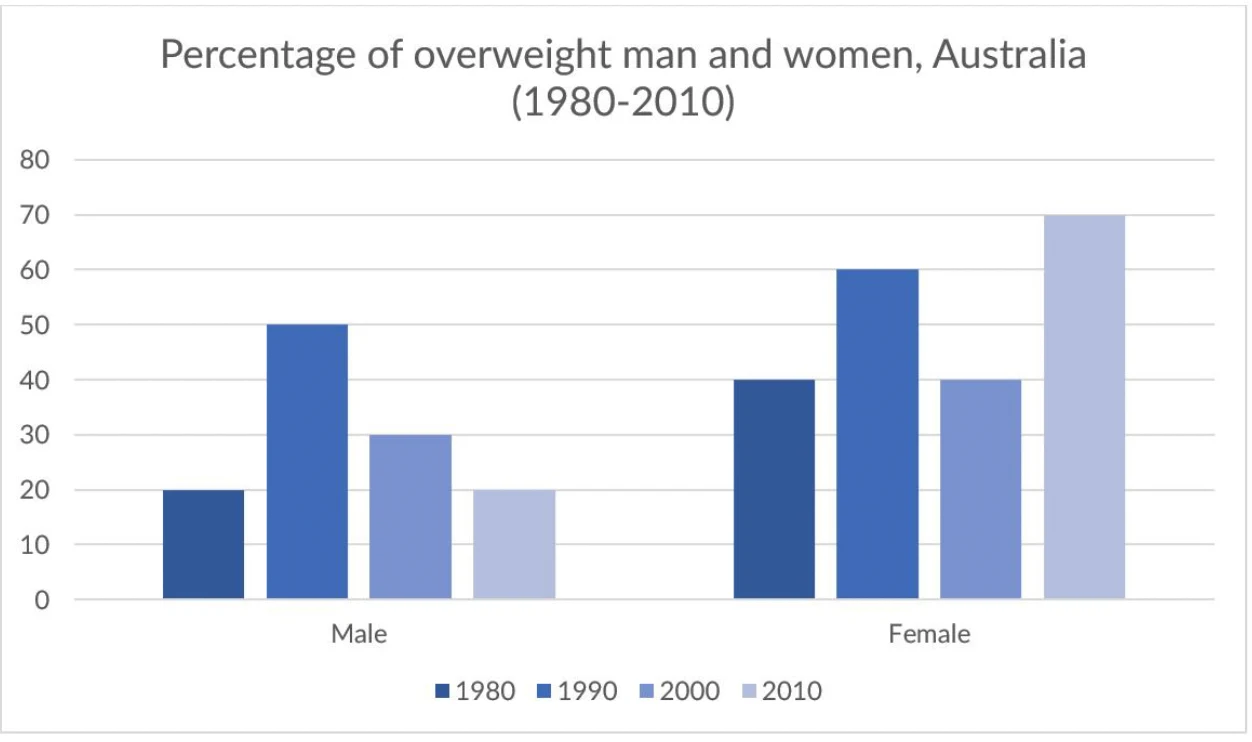
The chart below gives information about the percentage of overweight men and women in Australia from 1980 to 2010.
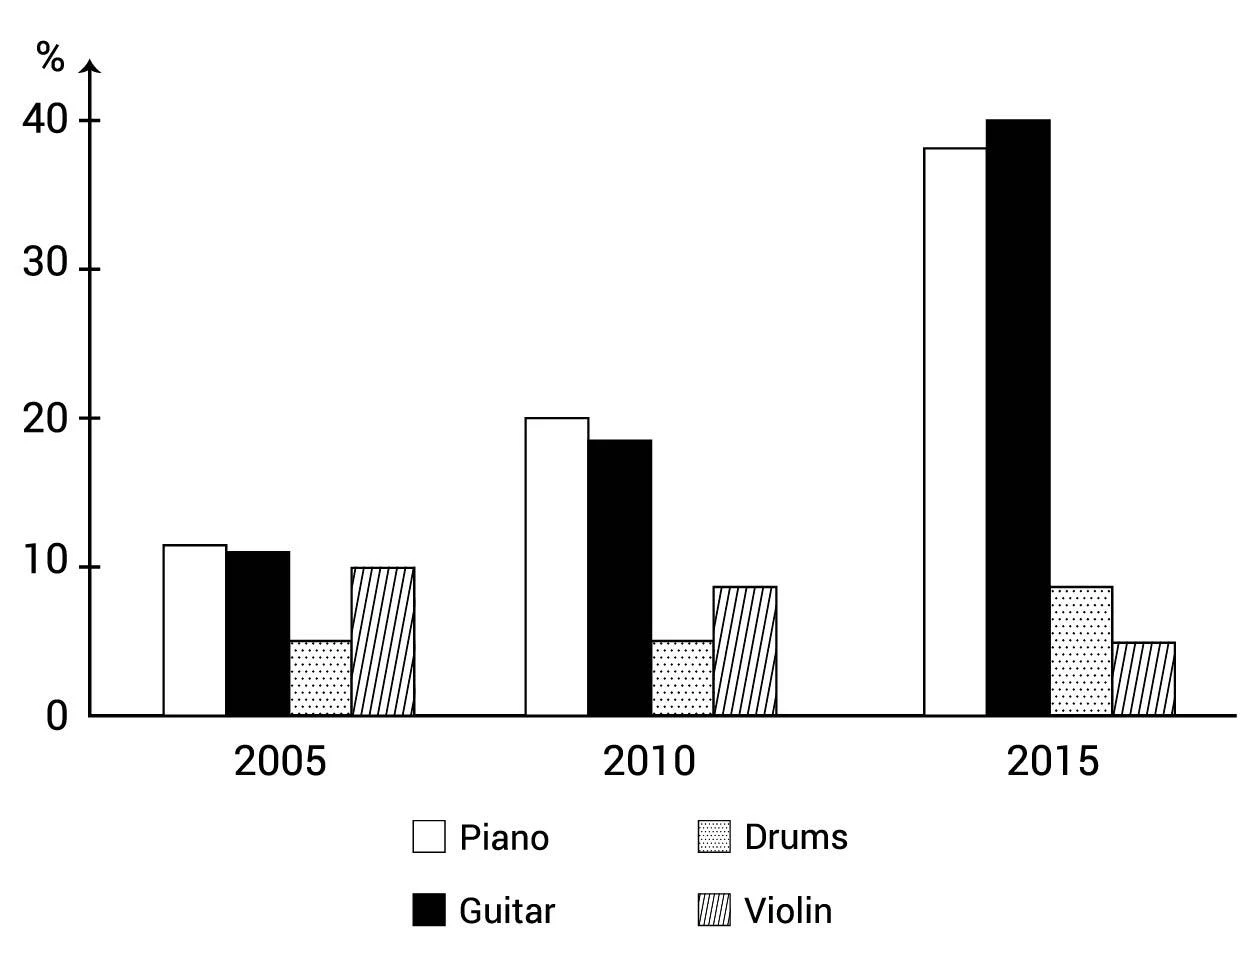
The bar chart shows the percentage of school children learning to play different musical instruments in 2005, 2010 and 2015.
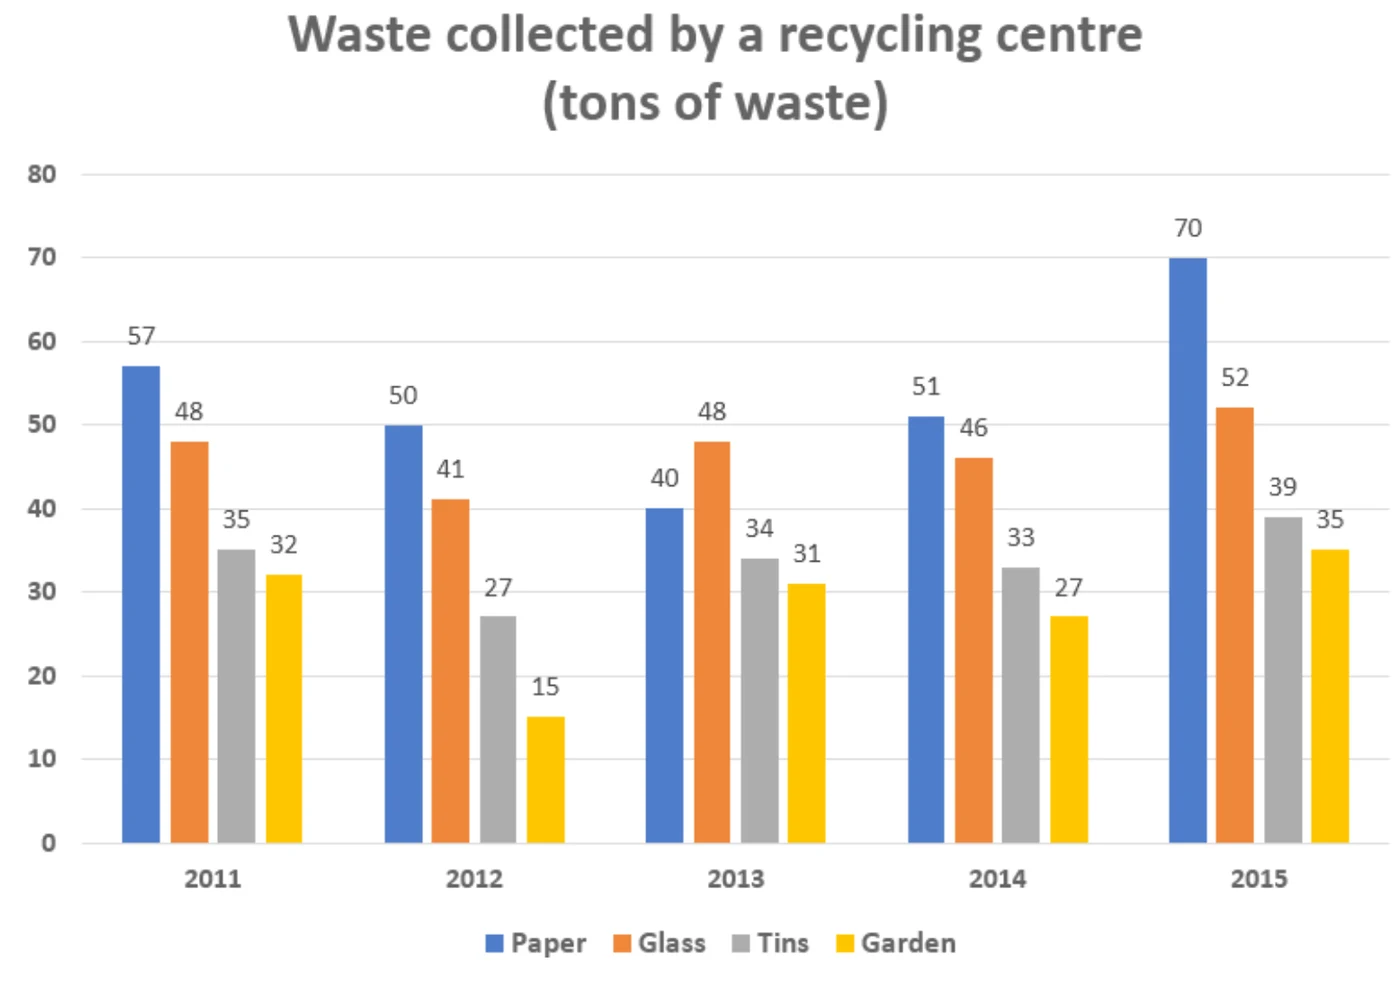
The chart below shows waste collection by a recycling centre from 2011 to 2015.
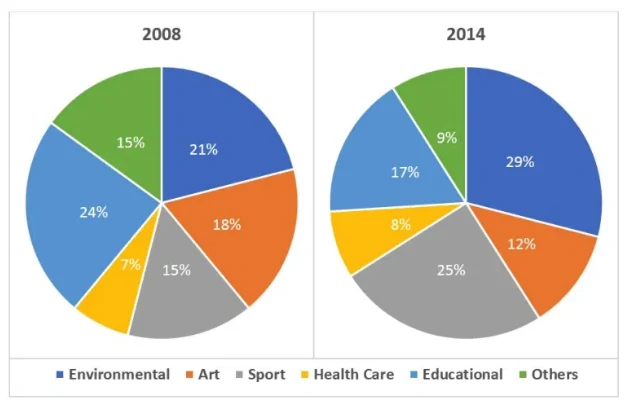
The charts below show the percentage of volunteers by organizations in 2008 and 2014.
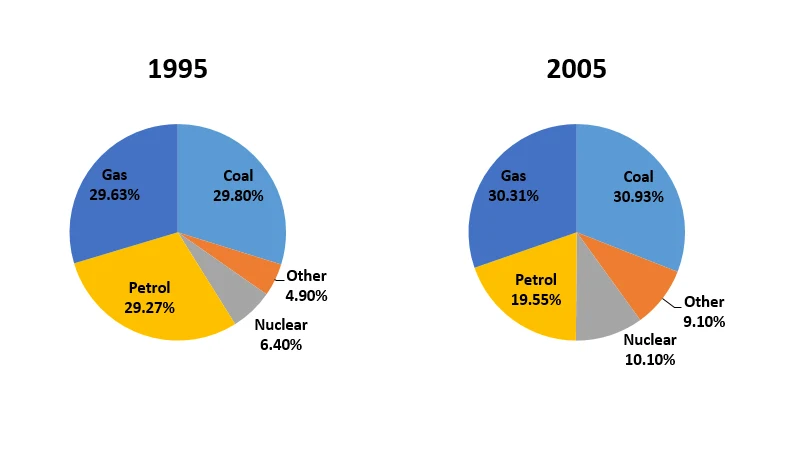
The charts below show the comparison of different kinds of energy production in France in two years.
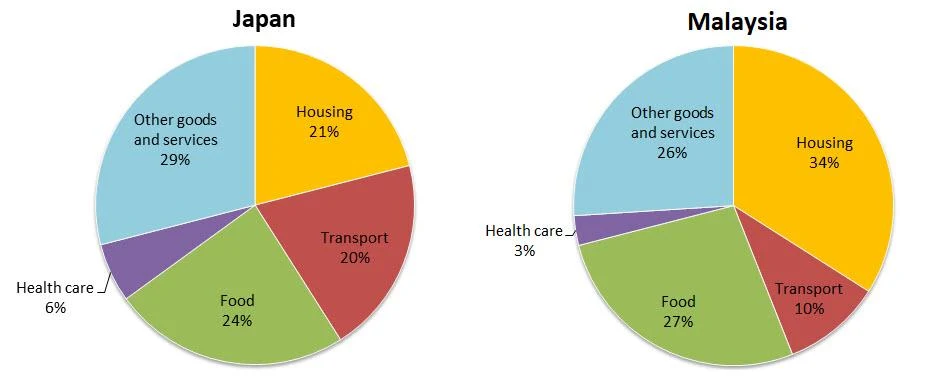
The charts below show the average household expenditures in Japan and Malaysia in the year 2010.

The charts below show the differences in how people in 3 countries learned English in 2010 and 2015.

The charts below show the percentage of people aged 23-65 in different occupations in one UK town (Ashby) and in the UK as a whole in 2008.

The charts below show the results of a survey conducted by a university on the opinions of full-time and part-time students about its services.

The charts below show the percentage of electricity consumed by different sectors in Eastern Australia in 2007 and 2010.
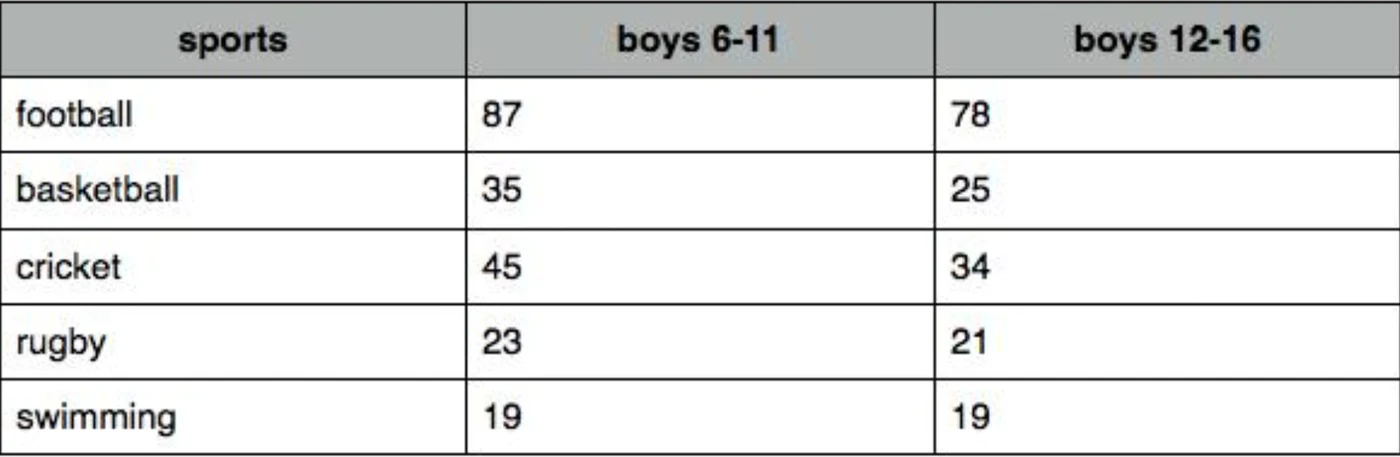
The chart below shows the percentage of school-aged boys in two different age groups who participated in 5 different sports in the UK in 2010.
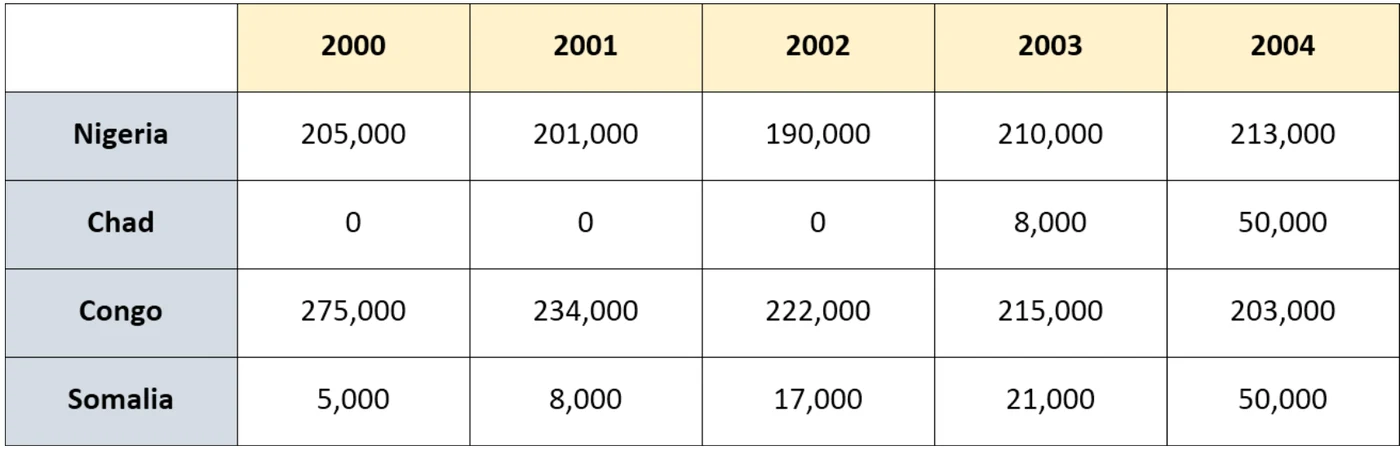
The chart below shows daily oil production in 4 countries from 2000 to 2004.
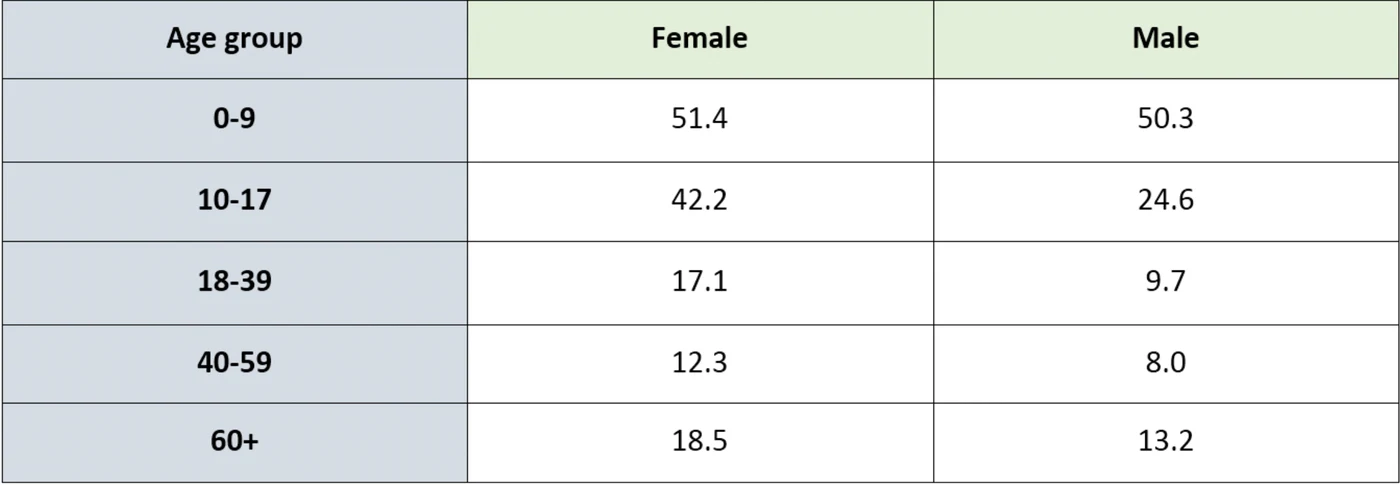
The table below shows the percentages of the population by age groups in one town who rode bicycles in 2011.

The pictures show information about average income and spending on food and clothes by an average family in a city in the UK.
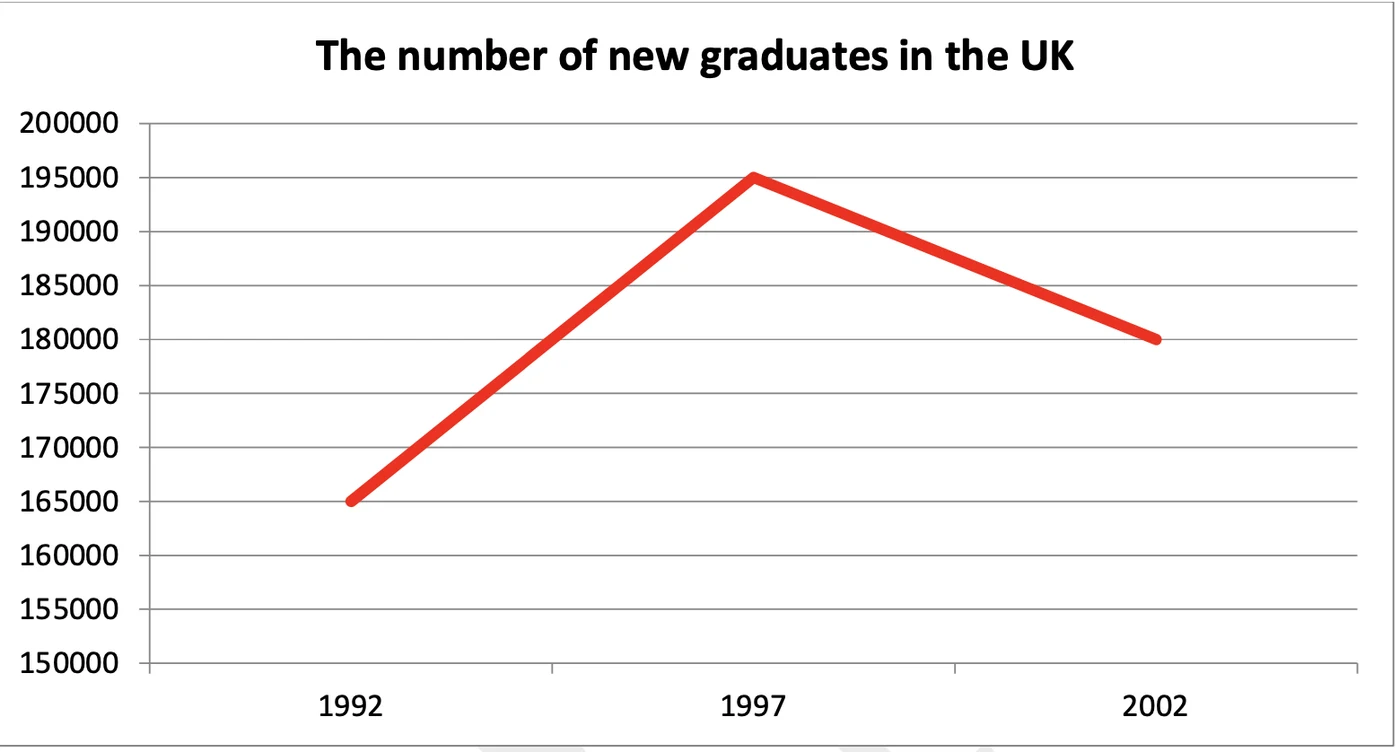
The graph and chart below give information about the number of new graduates and their employment in the UK from 1992 to 2002.
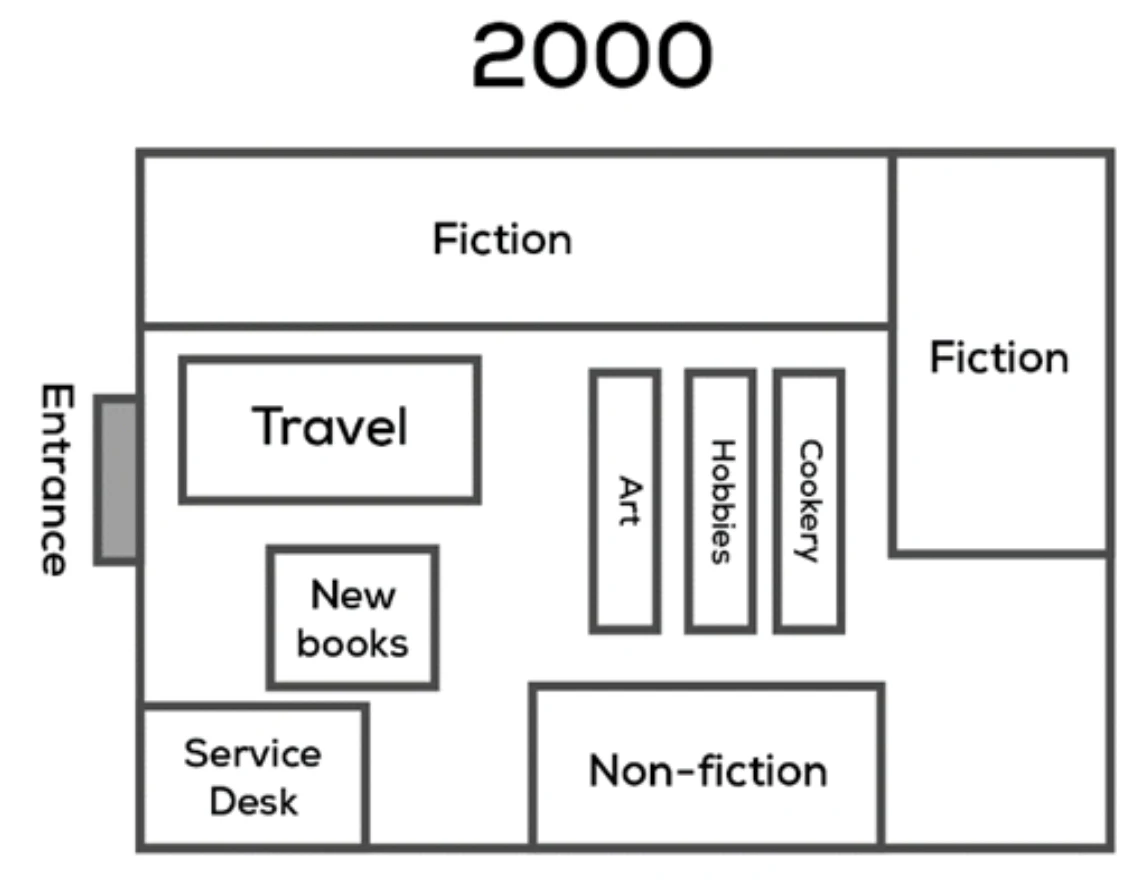
The maps below show a bookstore in 2000 and now.
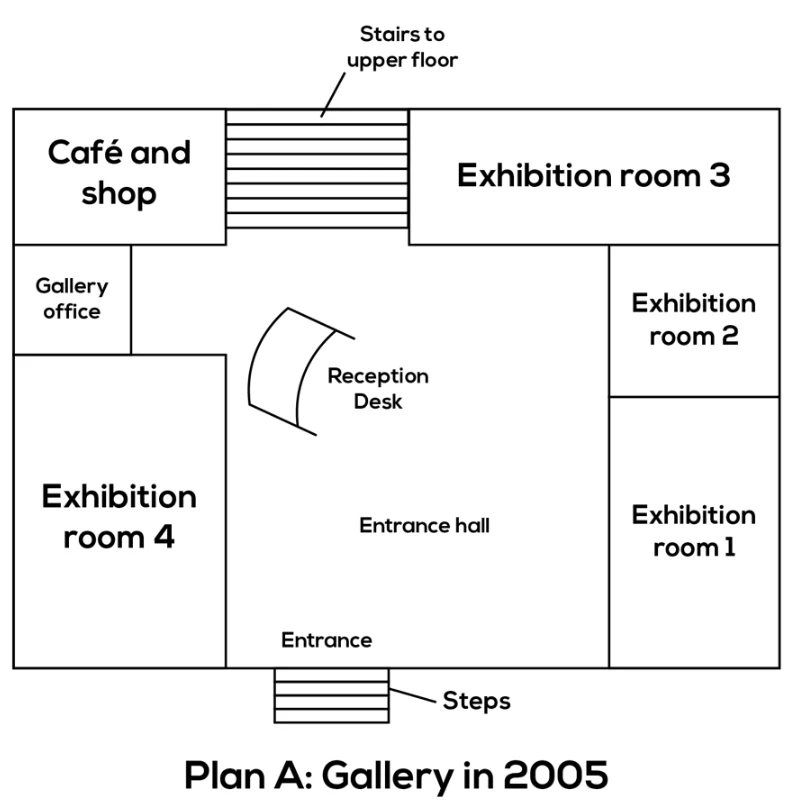
Plan A below shows the ground floor of a particular art gallery in 2005 and plan B shows the same area in the present day.
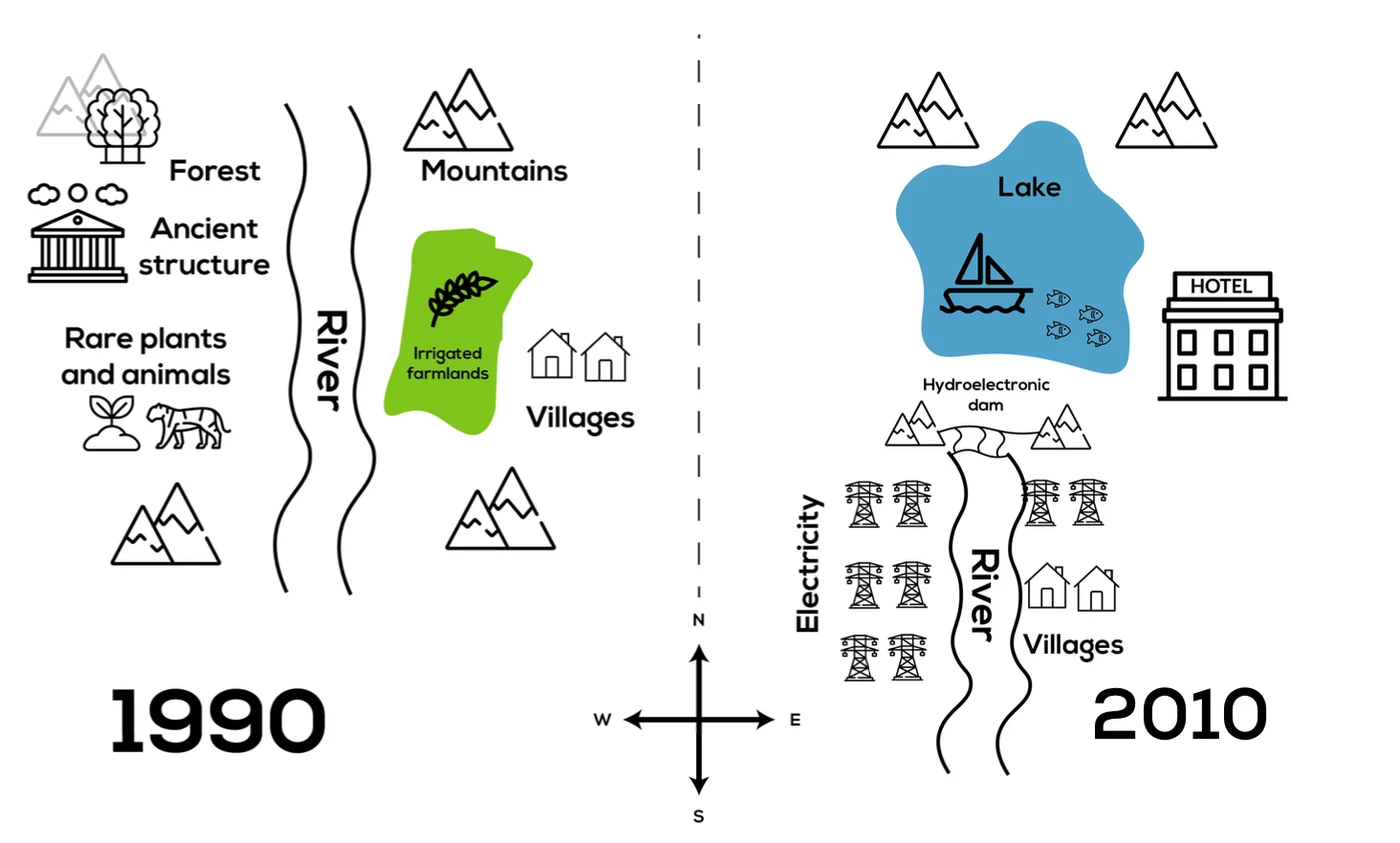
The maps below show the changes in a town after the construction of a hydroelectric power dam.
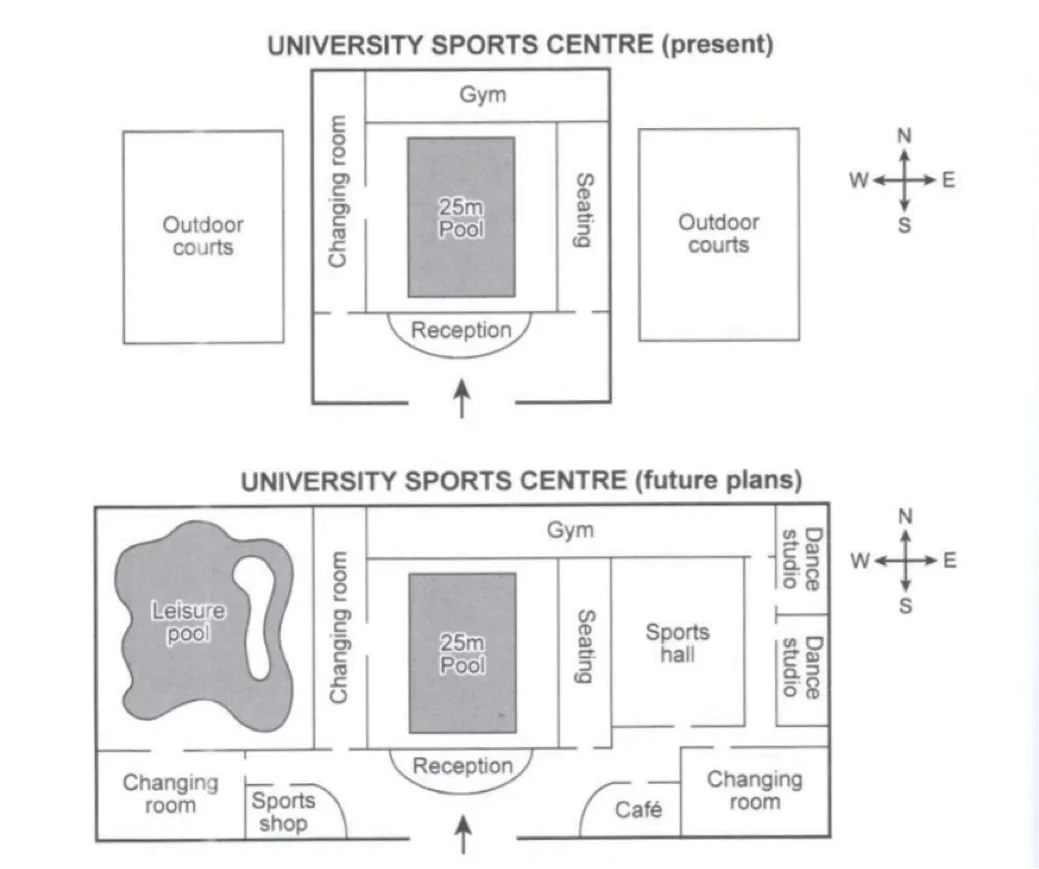
The plans below show the layout of a university’s sports center now, and how it will appear after redevelopment.
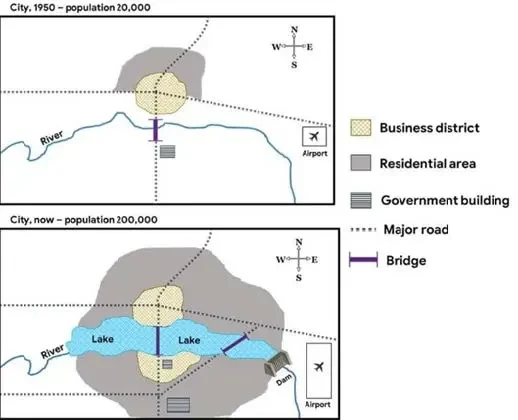
The maps show changes in a city in 1950 and now.
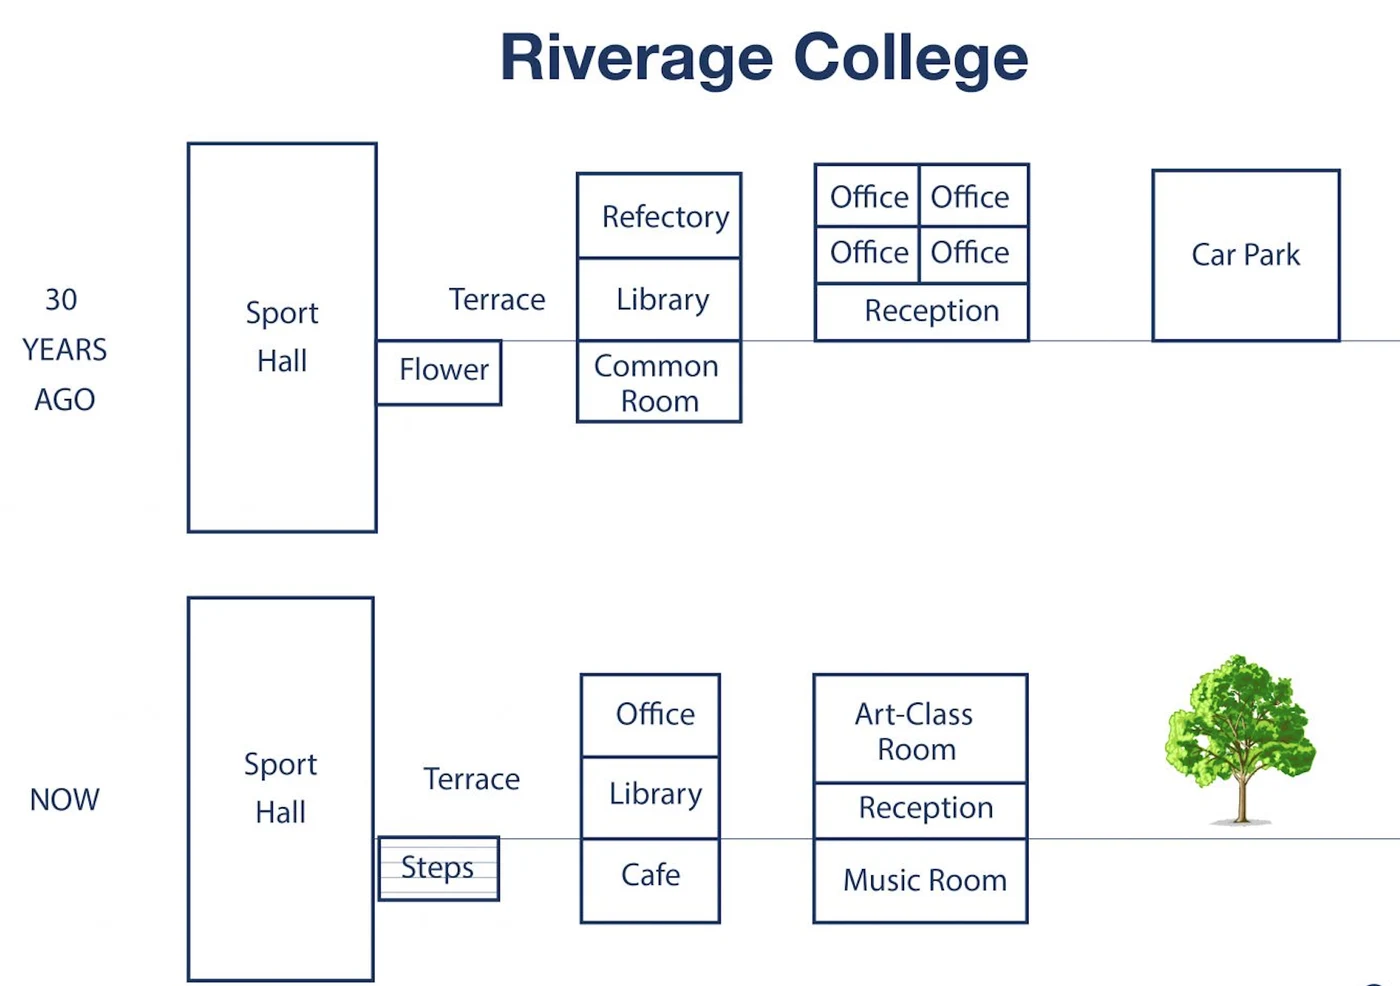
The maps below show information about the change of Riverage college 30 years ago and now.
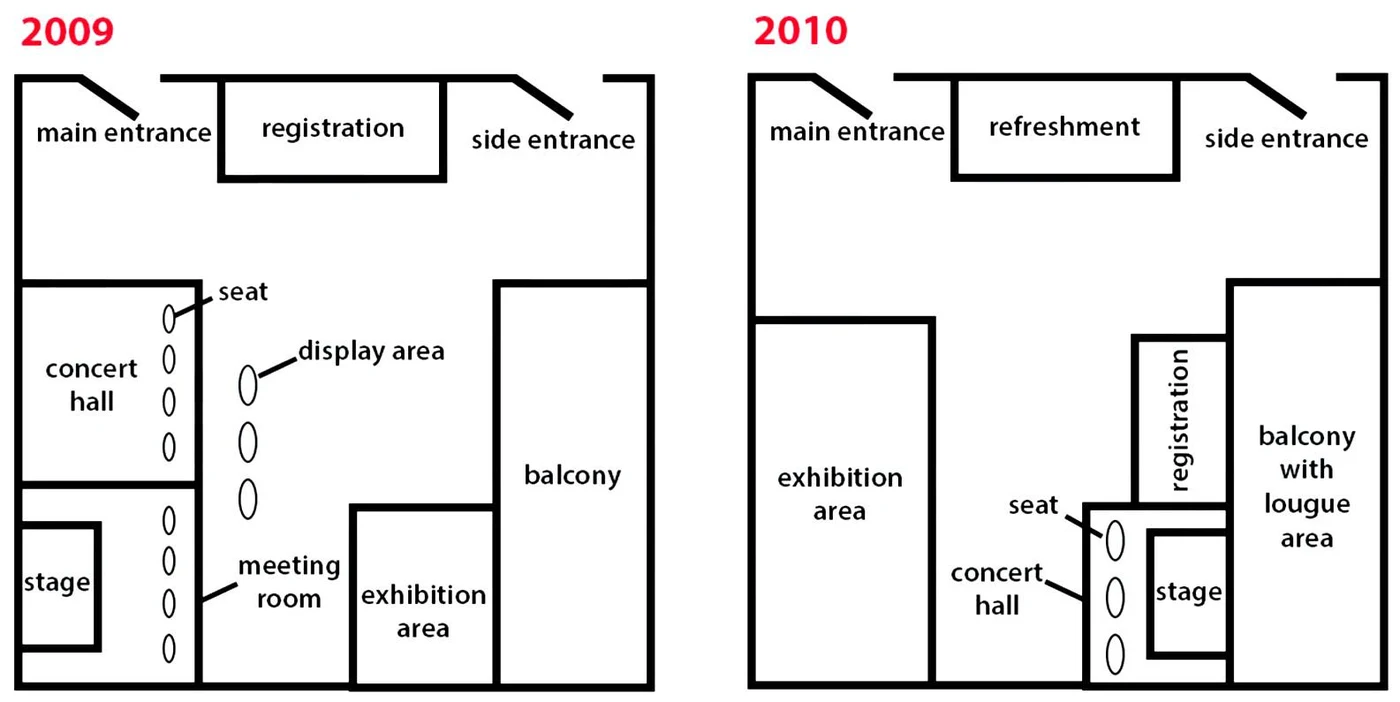
The maps below compare 2 floor plans of one trade conference held in 2009 and 2010.
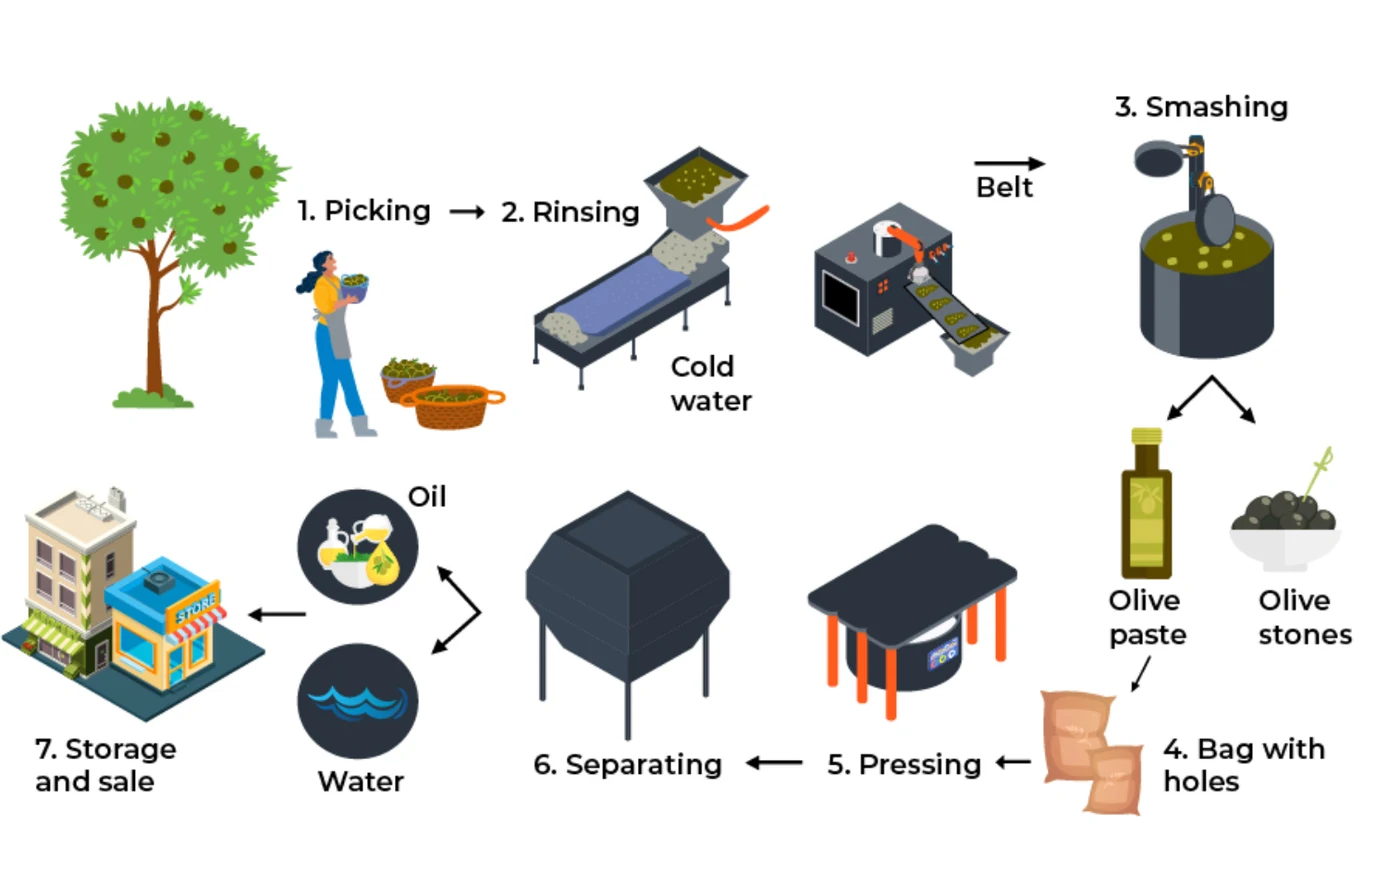
The diagram below shows the production of olive oil.

The diagram below shows how orange juice is produced.
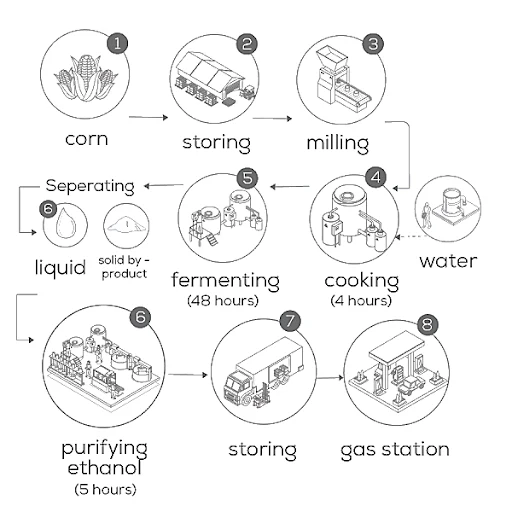
The diagram below shows how ethanol fuel is produced from corn.
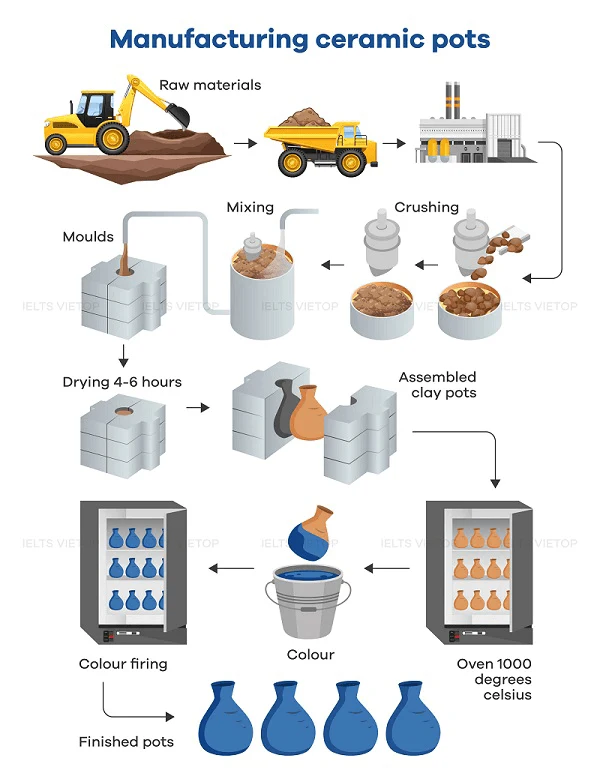
The diagram below shows one way of manufacturing ceramic pots.
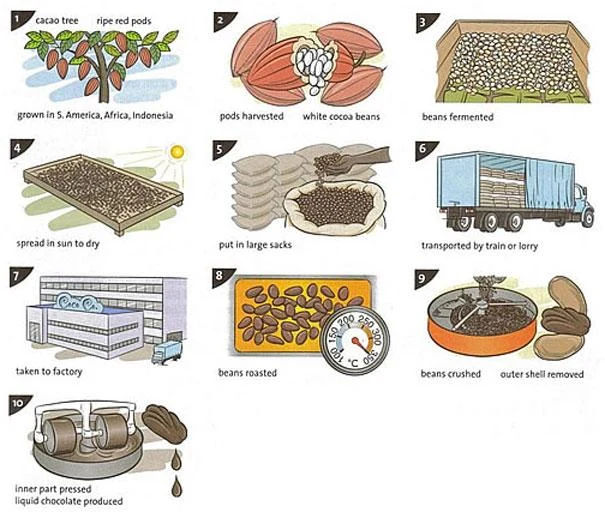
The picture shows how chocolate is produced.
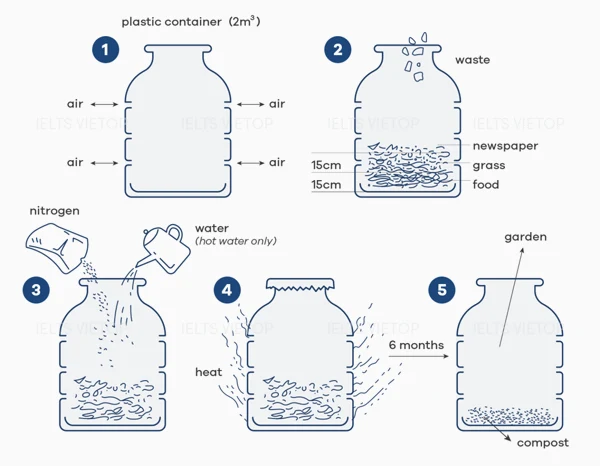
The picture shows how to recycle organic waste to produce fertiliser (compost).